Our sun is going into hibernation and that means more temperature drops
06/03/2021 / By News Editors

Each sunspot cycle has been getting less intense. This means temperature drops… And right now, the weather is following this trend.
(Article republished from StrangeSounds.org)
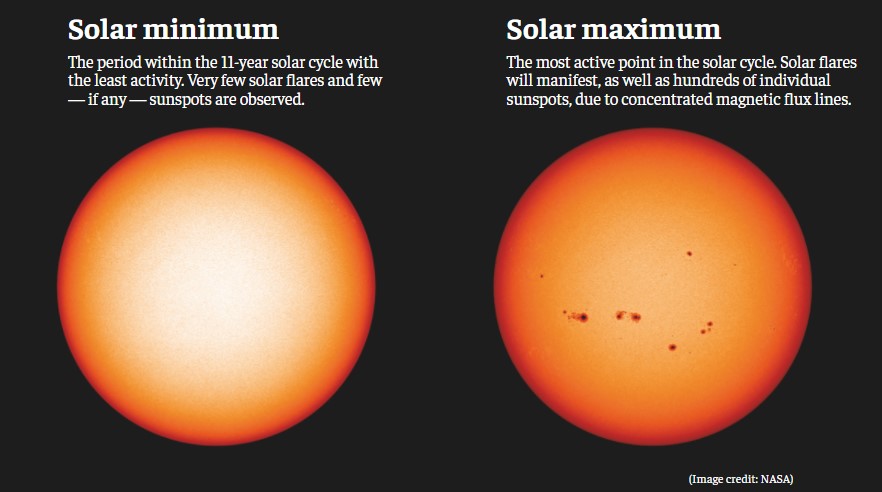
Comparison between solar maximum and solar minimum. Picture: NASAJust a few days ago, I discussed the space weather forecast of several scientists for solar cycle 25. While some very big solar storms have already taken place, the new cycle is week in overall.
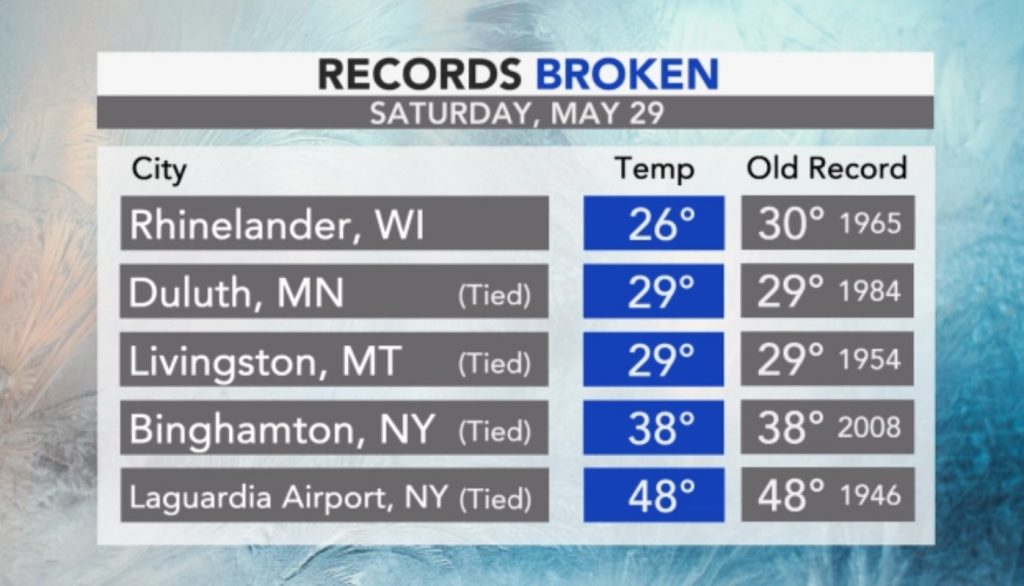
Meanwhile, dozens of cold records were broken or shattered on Saturday across Northeast US.
As shown in previous articles, freezing cold temperatures in April and May 2021 were responsible for damage or total destruction of crops, fruits and vegetables as well as harvest delays in Europe.
So is our star falling asleep?
Solar activity refers to the state of the sun’s magnetic field and associated phenomena: sunspots, flares, solar wind and coronal ejections. During periods of minimal solar activity, such events are often uncommon and weak. During solar maximum, they’re at their strongest and most frequent. Magnetic field fluctuations on the sun can happen on drastically different timescales, ranging from seconds all the way to billions of years. When astronomers speak of a “slowdown” or a period of quiescence in the sun’s activity, it doesn’t mean the sun will stop shining, but that there’s a slowdown in activity.
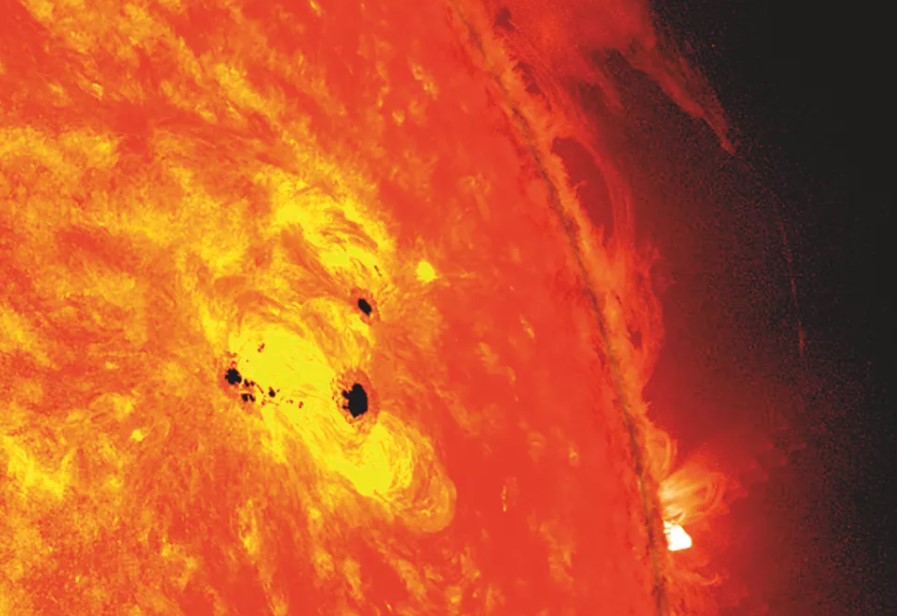
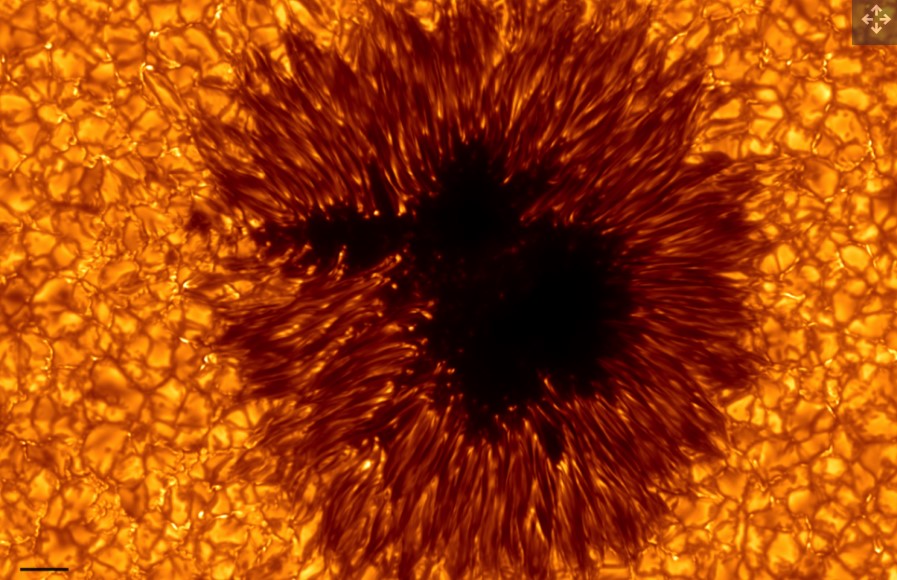
The sun has one particular rhythm, lasting approximately 11 years, in which its polar magnetic field flips polarity. Sunspots serve as an indicator of this change. Indeed, it’s often known as “the sunspot cycle.”
Although sunspots themselves were first observed in detail by Galileo, Christoph Scheiner and others from 1609 onwards, according to the British Library, the cyclical nature of their appearance and disappearance was first noted in 1775 by Danish astronomer Christian Horrebow. It was then rediscovered in 1843 by Heinrich Schwabe. In 1848, Swiss astronomer Rudolf Wolf used Schwabe and others’ results, as well as performing his own observations, to calculate the 11-year cycle and a mathematical method to count the number of sunspots. This so-called “Wolf number” remains in use today, according to the National Oceanic and Atmospheric Administration (NOAA).
Many other astronomers at the time either independently observed this cycle or were inspired by the results of others. Wolf’s own calculation of the 1755 to 1766 sunspot cycle was labeled as the first, and each sunspot cycle since then has been progressively numbered as such. We are now in Cycle 25.
But sometimes the spots don’t appear at all. This was the case for 80 days of the first six months of the current solar cycle, which started in December 2019. It was greater still for the same period in Cycle 24, where there were 281 spot-free days. The period from 1645 to 1715 saw a near-total crash in sunspot numbers, where they could literally be counted on two hands.
Wolf struggled to piece together solar cycles before the mid-1700s because of this dearth of information, but it didn’t mean sunspots weren’t being observed. Many distinguished astronomers of the age, such as Giovanni Cassini, continued to make observations. This 70-year solar lull was later noted by German astronomer Gustav Spörer, which then later inspired the British-Irish husband and wife team Edward and Annie Maunder. The period has since been named the Maunder minimum, according to Encyclopedia Britannica.
There have been other lulls before and since, such as the Spörer and Dalton minima. However, Madhulika Guhathakurta, a heliophysicist at NASA, speaking in a personal capacity, questioned how the technology available then affected observations. “During the Maunder minimum, when we couldn’t detect any sunspots, the question remains how well could we detect very faint sunspots then or even now?” she told All About Space. We don’t know and have no measure of that. The uncertainty associated with detecting no sunspots is much harder than counting them during solar maximum.”
In 2020 Cycle 25 had 80% more sunspots overall than the equivalent period for Cycle 24, suggesting that the current cycle may in fact be stronger, rather than weaker. The international Solar Cycle 25 Prediction Panel said in September 2020 that they expect Cycle 25 to be about as strong as Cycle 24. Has the consensus changed since then, or is it still the same?
“The consensus has not changed,” panel co-chair Doug Biesecker told All About Space. The consensus is still that the current cycle will be much like Cycle 24. “We have not seen anything that differs significantly in the early stages of this cycle that varies from the panel prediction of a peak of 115 [sunspots] in July 2025.” The predictions are based on the 13-month “smoothed sunspot number” — a statistical method for calculating sunspots. And you have to be patient when studying the sun. As Biesecker said: “It can take up to three years after the cycle begins before we can say with confidence whether the prediction is still valid.”
Guhathakurta believes this cycle is not out of the ordinary. “Looking at sunspots as a non-physical index of solar activity, I think this solar cycle isn’t unusual, especially in the context of the prior cycle. This cycle’s sort of mimicking that. Even in the early 1800s and 1900s, you see cycles of this magnitude.”
Successfully predicting solar weather is certainly essential when testing scientific theories about how the sun works. But there’s a more pressing practical reason for doing so. Strong solar flare events and coronal mass ejections — most likely to occur around the time of solar maxima — can disrupt modern technology.
The flux of high-energy particles can damage spacecraft, satellites and even ground-based power systems. The latter are particularly vulnerable, as solar radiation easily disturbs Earth’s magnetic field, inducing currents in long power lines. Such a geomagnetic storm destroyed large grid transformers and shut down the whole of Quebec, Canada, in March 1989, NASA reported. And this was just history repeating itself. In September 1859 a geomagnetic storm, dubbed the Carrington event, caused interesting problems with the telegraph system.
Telegraph operators noticed that they could disconnect their batteries and work with just the induced currents from the storm — sometimes with improved results! To this day it is the most powerful coronal mass ejection on record. If a Carrington-level event were to happen now, it would cause widespread damage and disruption to power systems and satellites. As well as decimating electronics, any astronauts venturing beyond the protective blanket of Earth’s geomagnetic field — such as to the moon or Mars — would be in danger, something that NASA’s upcoming Artemis lunar program needs to keep in mind.
Considering the stakes, coupled with the fact that the sun is such a complex system, there must be another way to glean information about its future behavior besides sunspots. Other tried-and-trusted methods exist, but there may well be another arrow in the quiver. A U.S.-U.K. team led by Scott McIntosh of the High Altitude Observatory at the National Center for Atmospheric Research in Boulder, Colorado, has looked at a phenomenon related to sunspot activity.
Using data from sources such as NASA’s Solar Dynamics Observatory, the team looked at extreme ultraviolet and X-ray flashes in the solar corona. These so-called “bright points” in the sun’s atmosphere correlate with large areas of material flowing in the sun’s interior, which rotates faster than surface plasma, similar to rates seen for sunspots. Robert Leamon of the University of Maryland likened it to helium balloons being dragged along by weights attached to the bottom.
Such a study is potentially more useful than the sunspot cycle as it shows magnetic polarity. In the 19th century, Richard Carrington and Spörer both discovered sunspots appearing at different latitudes during different points in the solar cycle, starting at mid-latitudes and migrating towards the equator at the end. Plotted against time, this leads to a distinctive “butterfly” diagram.
But in the early 20th century, American astronomer George Ellery Hale proved the importance of solar magnetism by showing how a complete polar flip actually spans two sunspot cycles: a flip, then a flip back, according to NASA. This 22-year Hale cycle is what McIntosh’s team looks at. The bright points are markers of Hale cycle magnetic bands.
This begs the question of why the wider solar scientific community doesn’t make more use of such observations in this way. “Folks have in the past — calling them ephemeral active regions — but predominantly they are locked into the ‘big white whales’ of solar activity: sunspots,” McIntosh said. Just like sunspots, the magnetic bands travel the latitudes of the sun to meet at the equator, annihilating in what McIntosh calls “termination events.” His team uses these termination events to identify complete 22-year magnetic cycles, as well as the 11-year sunspot cycles of the past.
Using these alongside predictions made for a 2020 terminator event, the team predicts that Solar Cycle 25 will, in fact, be strong. In marked contrast to scientific consensus, they say it will be among the strongest ever recorded.
Biesecker is supportive of the team’s approach: “The work from McIntosh et al is very intriguing. It would be very exciting to have their prediction come true, as it would help teach us about how to better predict future solar cycles.” But he does have a caveat. “The McIntosh technique has yet to make a true prediction. That is, one for which there is no knowledge of the future. It’s very difficult for a panel to give much weight to a technique that is new, which has never made a prediction that can be tested.” He says other, more traditional methods continue to be used, as they have been successful in the past and are better known.
If McIntosh’s study is right, however, what could it say about the solar interior? “That the magnetic systems inside the sun are much stronger than we anticipate and that they interact strongly to shape the production of spots,” McIntosh said. The pressure of the magnetic field band relative to the surroundings is important: “My sense is that the sun really wants to be balanced, and what we see in terms of sunspots is the result of imbalance in that pressure — globally, locally and longitudinally.” This means they think they’re only seeing the tip of the iceberg where the magnetic field is concerned.
McIntosh also said that the recurrence of 55-degree latitude bands in their analysis, which can be traced back through the entire observational and photographic record, is very overlooked. It suggests structural or geometric features that play a significant role in forming and aggregating the magnetic field in the sun’s interior.
There are still many open questions. But is the team’s approach bearing out for space weather forecasting? As Leamon said: “It’s too early to tell, but so far the observed sunspot number and other measures, such as F10.7 solar radio flux [10.7 centimeter-wavelength radio waves] are tracking closer to our higher predictions rather than the lower panel consensus. Whatever happens with the sunspot level, there will be some big storms, and our technological society will be impacted in some way or another during Solar Cycle 25.”
McIntosh concurred: “Indications are that it’s on track to be bigger than 24, and likely 23 too. But we really need the termination event to happen to get real fidelity on the forecast.” He’s still convinced that it’ll be a larger-than-average cycle, perhaps even in the top 10 of every one on record. “But until that event happens, we won’t know for sure.”
Biesecker’s looking further ahead. “The relevance of the Hale cycle, as detailed in McIntosh et al, will be something for the Solar Cycle 26 Panel to consider.” He points out that looking at the 22-year Hale cycle isn’t new to forecasting, and that scientists have looked at the effects of odd and even cycles in the past, although with less skill than looking at precursors of the next immediate cycle. “Expect the McIntosh technique to be a big part of the conversation when the panel to forecast Solar Cycle 26 convenes,” he tantalisingly concluded.
Future technology could also pave the way for a better understanding of solar activity, according to Guhathakurta. “I spent the last four years at NASA Ames Research Center shaping a program called Frontier Development Lab and got fascinated by artificial intelligence and how we might utilize our data and the tools of AI to infer patterns that can better guide physics outcomes,” she told All About Space. “Machine learning and AI could be critical for understanding solar variability and climate with huge amounts of data.” [Space]
Read more at: StrangeSounds.org and Cosmic.news
Tagged Under: environment, solar maximum, solar minimum, solar system, Space, sun, weather
RECENT NEWS & ARTICLES
COPYRIGHT © 2017 SPACE.COM
All content posted on this site is protected under Free Speech. Space.com is not responsible for content written by contributing authors. The information on this site is provided for educational and entertainment purposes only. It is not intended as a substitute for professional advice of any kind. Space.com assumes no responsibility for the use or misuse of this material. All trademarks, registered trademarks and service marks mentioned on this site are the property of their respective owners.


